TL;DR: In 609 overweight adults without diabetes, a healthy low-fat diet and a healthy low-carbohydrate diet produced similar 12-month weight loss, and neither genotype pattern nor insulin secretion predicted which diet worked better.
Healthy low-fat and healthy low-carbohydrate diets tied at 12 months
In the Diet Intervention Examining The Factors Interacting with Treatment Success (DIETFITS) randomized clinical trial, participants assigned to a healthy low-fat (HLF) diet lost a mean of 5.3 kg at 12 months, compared with a mean loss of 6.0 kg for participants assigned to a healthy low-carbohydrate (HLC) diet, according to the JAMA report titled Effect of Low-Fat vs Low-Carbohydrate Diet on 12-Month Weight Loss in Overweight Adults and the Association With Genotype Pattern or Insulin Secretion.
The mean between-group difference was 0.7 kg, with a 95% confidence interval of −0.2 to 1.6 kg, which was not statistically significant. The trial authors concluded that there was no significant difference in weight change between the two approaches over 12 months.
The study also tested two hypothesized predisposing factors: a 3 single-nucleotide polymorphism (SNP) multilocus genotype responsiveness pattern and baseline insulin secretion measured as INS-30, the blood concentration of insulin 30 minutes after a glucose challenge. Neither factor was associated with the dietary effect on weight loss in the primary analyses.
The interaction test for diet and genotype pattern yielded P = .20. The interaction test for diet and insulin secretion yielded P = .47. The investigators reported that neither of the two hypothesized factors was helpful for identifying which of the two diets was better for whom.
Who enrolled and how the trial was timed
DIETFITS enrolled 609 adults aged 18 to 50 years without diabetes who had a body mass index (BMI) between 28 and 40. Mean age at randomization was 40 years, with a standard deviation of 7 years. Women comprised 57% of the randomized population.
Mean BMI was 33, with a standard deviation of 3. Mean baseline INS-30 was 93 μIU/mL. Among participants, 244 individuals, or 40%, had a low-fat genotype pattern, while 180 individuals, or 30%, had a low-carbohydrate genotype pattern.
Enrollment ran from January 29, 2013, through April 14, 2015. The date of final follow-up was May 16, 2016. Of the 609 participants randomized, 481 participants, or 79%, completed the trial.
Randomization assigned 305 participants to the HLF diet and 304 participants to the HLC diet. The trial was conducted by investigators at the Stanford Prevention Research Center in the Department of Medicine at Stanford University School of Medicine in Stanford, California, with collaboration from the Quantitative Sciences Unit, the Department of Health Research and Policy, the Department of Statistics, and the Department of Biomedical Data Science.
The corresponding author was Christopher D. Gardner, PhD, of the Stanford Prevention Research Center. Coauthors included John F. Trepanowski, Liana C. Del Gobbo, Michelle E. Hauser, Joseph Rigdon, John P. A. Ioannidis, Manisha Desai, and Abby C. King.
What the two diet interventions actually required
Health educators delivered the behavior-modification intervention through 22 diet-specific small-group sessions administered over 12 months. Sessions focused on ways to achieve the lowest fat or carbohydrate intake that could be maintained long-term and emphasized diet quality.
Both groups were instructed to maximize vegetable intake. Participants were advised to choose nutrient-dense whole foods, to cook at home when possible, to avoid trans fats and added sugars, and to limit refined flour. Neither group received an explicit prescribed energy restriction or a specific calorie target in the intervention description.
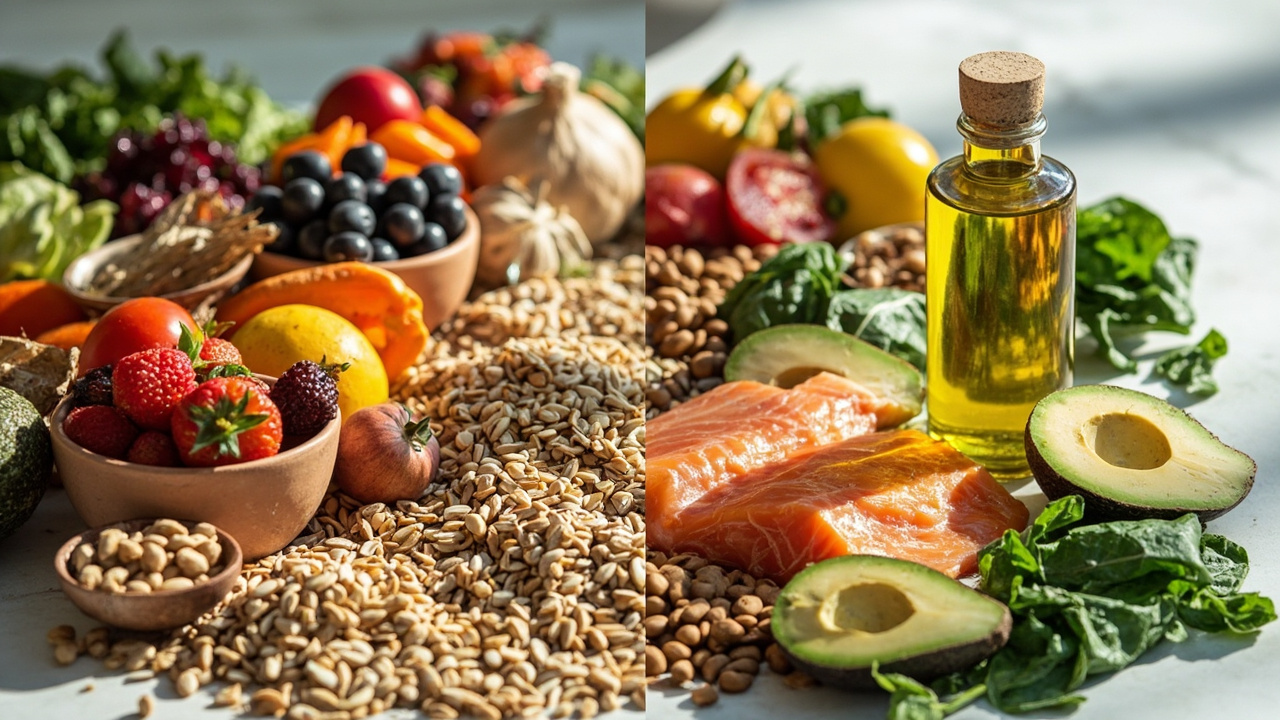
For the HLF group, guidance centered on reducing total fat intake while selecting high-quality carbohydrate-containing foods, including vegetables, legumes, fruits, and whole grains. For the HLC group, guidance centered on reducing total carbohydrate intake while selecting high-quality fat-containing foods, including olive oil, avocado, hard cheeses, nuts, nut butters, and animal foods including grass-fed meats.
At 12 months, reported mean macronutrient distributions differed substantially between groups. In the HLF versus HLC groups, respectively, carbohydrates supplied a mean of 48% versus 30% of energy, fat supplied 29% versus 45%, and protein supplied 21% versus 23%.
Reported energy intake declined in both groups during follow-up. The trial collected dietary intake by unannounced 24-hour recalls at baseline and at follow-up points. Physical activity, body fat percentage, waist circumference, blood lipids, glucose, insulin, and other metabolic variables were also measured at baseline and follow-up.
There were 18 adverse events or serious adverse events that were evenly distributed across the two diet groups. The investigators reported no disclosures of potential conflicts of interest on the ICMJE forms.
Why genotype and insulin secretion were tested
Previous research had suggested that genotype or insulin-glucose dynamics might modify diet effects. The trial protocol described a retrospective observation in which overweight women classified as appropriately matched versus mismatched to a low-fat or low-carbohydrate diet based on multilocus genotype patterns showed about a 3-fold difference in 12-month weight loss, with mean values near 6 kg versus 2 kg.
Those earlier patterns used SNPs from three genes relevant to fat and carbohydrate metabolism: PPARG, ADRB2, and FABP2. Combinations were classified as consistent with a low-fat-responsive genotype pattern, a low-carbohydrate-responsive genotype pattern, or neither of the two main patterns. By design, as described in the initial National Institutes of Health grant application, individuals with neither of the main two patterns were not included in the main genotype analyses.
Several earlier studies had also reported that baseline insulin dynamics might explain differential weight-loss success on diets varying in carbohydrate and fat. DIETFITS therefore prespecified INS-30 as a second hypothesized effect modifier. INS-30 was defined as the blood insulin concentration 30 minutes after consuming 75 g of glucose as part of a standard oral glucose tolerance test.
In statistical modeling, INS-30 was treated as a continuous variable. For presentation, participants were grouped into tertiles. The mean for the lowest tertile was 40.8 μIU/mL, with a range of 7.3 to 60.6 μIU/mL. The mean for the middle tertile was 80.1 μIU/mL, with a range of 60.7 to 103.1 μIU/mL. The mean for the highest tertile was 159.6 μIU/mL, with a range of 103.4 to 562.5 μIU/mL.
The three-way interaction term among diet, genotype, and the 12-month time point had a beta coefficient of 1.38, with a 95% confidence interval of −0.72 to 3.49. The three-way interaction term among diet, insulin, and the 12-month time point had a beta coefficient of 0.08 for each 10-μIU/mL increase in insulin, with a 95% confidence interval of −0.13 to 0.28.
Thirty-nine participants had compromised or missing DNA and could not contribute to genotype classification. The numbers of participants shown in weight-loss distributions reflected individuals who had weight data at both baseline and 12 months, while statistical analyses included data from all randomized individuals as described in the Statistical Analysis section, according to the article archived in PubMed Central under the same title.
Baseline characteristics and measurement details
Mean weight at baseline was 97.5 kg in the HLF group and 96.3 kg in the HLC group. Among women, mean weight was 90.7 kg in the HLF group and 88.9 kg in the HLC group. Among men, mean weight was 105.7 kg in the HLF group and 106.8 kg in the HLC group.
Mean BMI was 33.4 in the HLF group and 33.3 in the HLC group. Mean body fat percentage was 36.3% in the HLF group and 36.5% in the HLC group. Among women, mean body fat was 41.0% versus 40.4%, respectively. Among men, mean body fat was 29.9% versus 30.3%, respectively.
Mean waist circumference was 107.2 cm in the HLF group and 106.7 cm in the HLC group. Among women, means were 103.5 cm versus 102.6 cm. Among men, means were 111.8 cm versus 112.7 cm.
Mean age was 39.3 years in the HLF group and 40.2 years in the HLC group. Women numbered 167 in the HLF group, or 54.8%, and 179 in the HLC group, or 58.9%. Men numbered 138 in the HLF group, or 45.2%, and 125 in the HLC group, or 41.1%.
White participants numbered 176 in the HLF group, or 57.7%, and 182 in the HLC group, or 59.9%. Hispanic participants numbered 67 versus 61, or 22.0% versus 20.1%. Asian participants numbered 30 in each group, or 9.8% versus 9.9%. African American participants numbered 10 versus 13, or 3.3% versus 4.3%.
Mean high-density lipoprotein cholesterol was 1.28 mmol/L in the HLF group and 1.29 mmol/L in the HLC group. Mean low-density lipoprotein cholesterol was 2.89 mmol/L versus 2.94 mmol/L. These lipid rows were later subject to a correction that changed units in Table 3 from mmol/L to mg/dL and reversed the corresponding conversion instructions, with corrections dated April 3, 2018, and April 24, 2018.
Funding, oversight, and interpretation for food choices
The study was supported by grant 1R01DK091831 from the National Institute of Diabetes and Digestive and Kidney Diseases, funding from the Nutrition Science Initiative, grants 1K12GM088033 and T32HL007034 from the National Heart, Lung, and Blood Institute, and the Stanford Clinical and Translational Science Award. The funders had no role in design and conduct, collection, management, analysis, or interpretation, preparation, review, or approval, or the decision to submit for publication.
The article was accepted for publication on January 17, 2018, and published online on February 20, 2018. Dr Gardner had full access to all data and took responsibility for data integrity and accuracy of analysis. Concept and design credits listed Gardner, Rigdon, Ioannidis, Desai, and King. Statistical analysis credits listed Gardner, Del Gobbo, Hauser, Rigdon, Ioannidis, and Desai.
Study operations involved coordinators Jennifer Robinson and Antonella Dewell, health educators including Rise Cherin, Susan Kirkpatrick, Jae Berman, Dalia Perelman, and Mandy Murphy Carroll, a diet-assessment team, recruitment and blood-sample staff, statistical support staff, and administrative support. The authors acknowledged the 609 participants without whom the investigation would not have been possible.
For readers comparing eating patterns, the central result is that two diet-quality-focused strategies produced overlapping average losses, with wide individual variation within each group. The trial did not establish that a DNA test for the studied SNPs or a baseline 30-minute insulin value should guide selection between a healthy low-fat pattern and a healthy low-carbohydrate pattern.
Consumers considering either pattern can discuss diabetes status, lipid levels, medication use, food preferences, cooking resources, and ability to attend counseling sessions with a clinician or registered dietitian. People with diabetes were not included in the randomized population, so the weight-change estimates apply to adults without diabetes in the studied age and BMI ranges.
Sources referenced
- Effect of Low-Fat vs Low-Carbohydrate Diet on 12-Month Weight Loss in Overweight Adults and the Association With Genotype Pattern or Insulin Secretion: The DIETFITS Randomized Clinical Trial | JAMA (https://jamanetwork.com/journals/jama/fullarticle/2673150)
- Effect of Low-Fat vs Low-Carbohydrate Diet on 12-Month Weight Loss in Overweight Adults and the Association With Genotype Pattern or Insulin Secretion: The DIETFITS Randomized Clinical Trial - PMC (https://pmc.ncbi.nlm.nih.gov/articles/PMC5839290/)